Get grafana on macOS and Linux Now!
The open and composable observability and data visualization platform. Visualize metrics, logs, and traces from multiple sources like Prometheus, Loki, Elasticsearch, InfluxDB, Postgres and many more
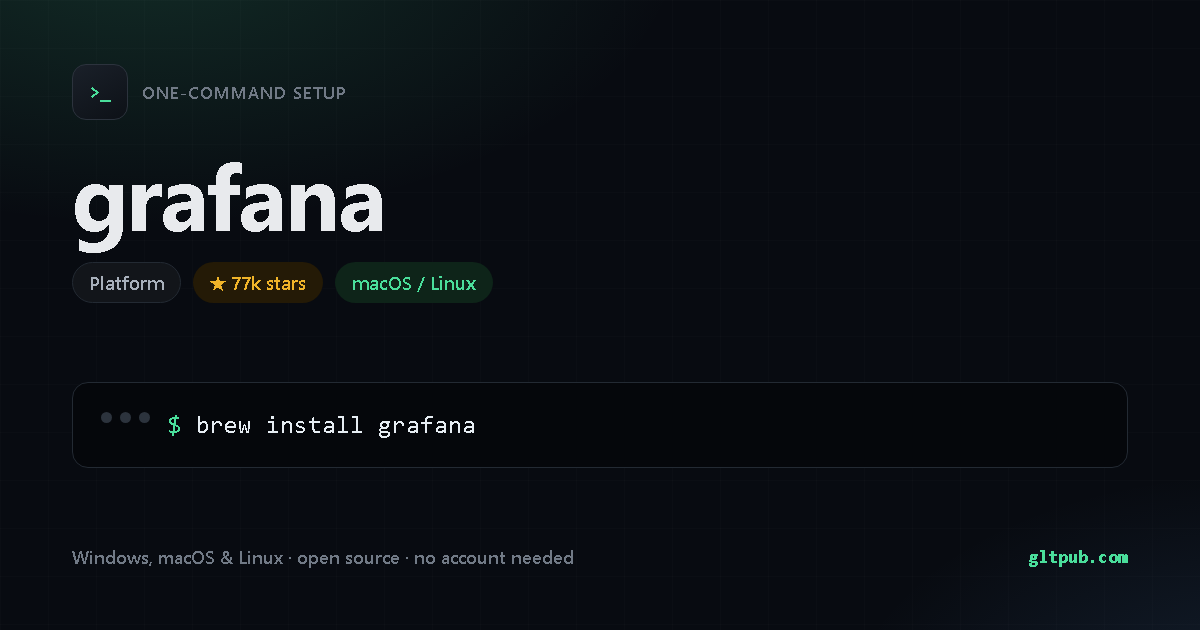
Get grafana with one command
Pick your system, reveal the step-by-step guide, copy the command, paste it into your terminal and press Enter. This command comes from the project's public source.
Not available for Windows yet.
grafana doesn't publish an install command for Windows anywhere we can verify, so there's nothing for us to show you. We won't invent one. It does document one for macOS and Linux — switch to that tab.
Pastes into PowerShell and installs grafana on your Windows machine in one step. Runs as your normal user account, and needs no administrator rights.
Not available for macOS yet.
grafana doesn't publish an install command for macOS or Linux anywhere we can verify, so there's nothing for us to show you. We won't invent one.
Installs grafana on your macOS or Linux machine and links it into your PATH — after this,
grafana just works from any directory. Runs as your normal user account, and needs no administrator rights.
How to set up grafana, step by step
Open Terminal. On a Mac it's in Applications ▸ Utilities, or press Cmd+Space and type Terminal. On Linux, press Ctrl+Alt+T. Paste the command and press Enter.
Run grafana --help to see the available commands, and
grafana --version to confirm the install worked. If your shell complains about
permissions, that project usually documents a corrected command on its own site.
This asks Homebrew to fetch grafana and link it into /opt/homebrew/bin (Apple Silicon) or /usr/local/bin (Intel), so you can run it by name.
About grafana
The open-source platform for monitoring and observability
From grafana's own README.
About grafana
The open and composable observability and data visualization platform. Visualize metrics, logs, and traces from multiple sources like Prometheus, Loki, Elasticsearch, InfluxDB, Postgres and many more
| Category | Platform |
|---|---|
| Install method | Homebrew |
| Windows | no install command published |
| macOS / Linux | documented install command available |
| Price | Free and open source |
| Command verified | From project source |
| Popularity | 77k stars on the project's public repository |
On mobile
grafana is a command-line tool, so there is no phone app for it — a phone has no shell to run it in. You'll need a desktop, or a remote shell into a machine that has one.
The project's own page is grafana.com
grafana is developed by its own authors. This page is an independent reference; we are not affiliated with or sponsored by the project. The command shown here was reproduced from the project's public documentation — always check the project's own documentation before running anything.